插件介绍
探索数学与Desmos!绘图功能,创建表格,添加滑块,动画你的图形,等等——所有这些都是免费的。
在Desmos,我们想象一个全民数学素养的世界,想象一个所有学生都能接触数学并享受数学的世界。我们相信,关键是在实践中学习。
为了实现这个愿景,我们首先构建了下一代图形计算器。使用我们强大而快速的数学引擎,计算器可以立即绘制出任何方程,从直线和抛物线到导数和傅立叶级数。滑块可以轻松地演示函数转换。这是一种直观的、美妙的数学。最棒的是:它是完全免费的。
特点:
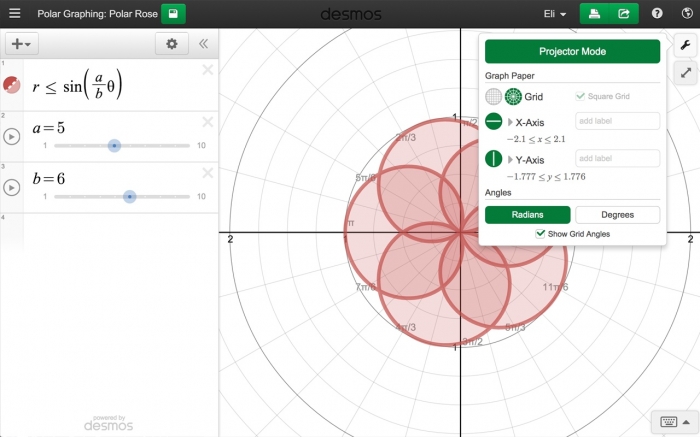
绘图:绘制极坐标图、笛卡儿图或参数图。对于一次可以绘制多少个表达式没有限制——你甚至不需要以y=形式输入表达式!
滑块:交互式地调整值以建立直觉,或动画任何参数以可视化其在图形上的效果
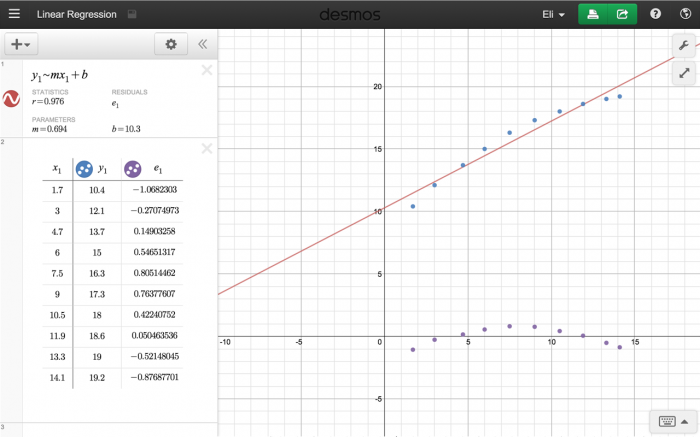
表格:输入和绘制数据,或为任何函数创建一个输入-输出表
统计:找到最适合的线、抛物线等。
缩放:可以单独缩放轴,也可以用两根手指捏一下同时缩放轴,或者手动编辑窗口大小,以获得完美的窗口。
感兴趣点:触摸曲线以显示最大值、最小值和交点。点击感兴趣的灰色点以查看它们的坐标。按住并拖动一条曲线,可以看到手指下坐标的变化。
科学计算器:只要输入任何你想解的方程,Desmos就会告诉你答案。它可以处理平方根,对数,绝对值等等。
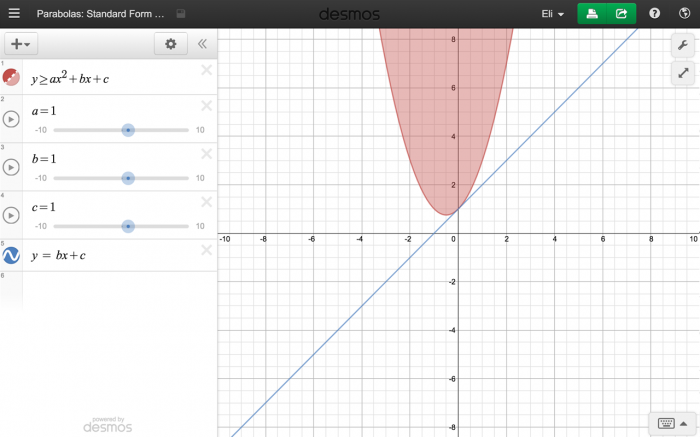
不等式:绘制笛卡尔不等式和极坐标不等式。
访问www.desmos.com了解更多信息。
Explore math with Desmos! Plot functions, create tables, add sliders, animate your graphs, and more -- all for free.
At Desmos, we imagine a world of universal math literacy and envision a world where math is accessible and enjoyable for all students. We believe the key is learning by doing.
To achieve this vision, we’ve started by building the next generation of the graphing calculator. Using our powerful and blazingly-fast math engine, the calculator can instantly plot any equation, from lines and parabolas up through derivatives and Fourier series. Sliders make it a breeze to demonstrate function transformations. It's intuitive, beautiful math. And best of all: it's completely free.
Features:
Graphing: Plot polar, cartesian, or parametric graphs. There’s no limit to how many expressions you can graph at one time - and you don’t even need to enter expressions in y= form!
Sliders: Adjust values interactively to build intuition, or animate any parameter to visualize its effect on the graph
Tables: Input and plot data, or create an input-output table for any function
Statistics: Find best-fit lines, parabolas, and more.
Zooming: Scale the axes independently or at the same time with the pinch of two fingers, or edit the window size manually to get the perfect window.
Points of Interest: Touch a curve to show maximums, minimums, and points of intersection. Tap the gray points of interest to see their coordinates. Hold and drag along a curve to see the coordinates change under your finger.
Scientific Calculator: Just type in any equation you want to solve and Desmos will show you the answer. It can handle square roots, logs, absolute value, and more.
Inequalities: Plot cartesian and polar inequalities.
Visit www.desmos.com to learn more.
浏览器插件安装详细步骤:Chrome浏览器如何安装插件扩展