给网友们整理相关的编程文章,网友居晴丽根据主题投稿了本篇教程内容,涉及到置信椭圆原理、椭圆图形绘制、置信椭圆、置信椭圆原理以及椭圆图形绘制相关内容,已被920网友关注,内容中涉及的知识点可以在下方直接下载获取。
置信椭圆原理以及椭圆图形绘制
置信椭圆原理及椭圆图形绘制
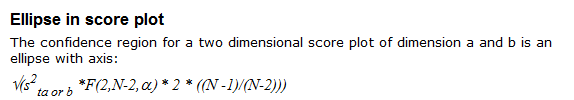
置信椭圆长短轴计算
    def confidence_oval(self,factor, ppf_rate):
        pca1_std = np.std(factor.iloc[:, 0])
        pca2_std = np.std(factor.iloc[:, 1])
        f_value = scipy.stats.f.ppf(ppf_rate, dfn=2, dfd=factor.iloc[:, 0].shape[0] - 2)
        x_axis = np.sqrt(
            pca1_std ** 2 * f_value * 2 * ((factor.iloc[:, 0].shape[0] - 1) / (factor.iloc[:, 0].shape[0] - 2)))
        y_axis = np.sqrt(
            pca2_std ** 2 * f_value * 2 * ((factor.iloc[:, 0].shape[0] - 1) / (factor.iloc[:, 0].shape[0] - 2)))
        x_axis = '%.2f' % x_axis
        y_axis = '%.2f' % y_axis

        return x_axis, y_axis
Python图形绘制
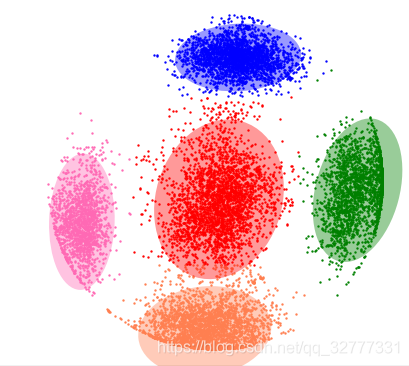
   def elli_plot(self,full_data, ellipse, y):
        '''

        :param full_data: pls后的点
        :param ellipse: [椭圆长轴,椭圆短轴]
        :param y:
        :return:
        '''
        fig = plt.figure(figsize=(15, 5))
        ax = fig.add_subplot(111)
        elli = Ellipse(xy=(0, 0), width=float(ellipse[0]) * 2, height=float(ellipse[1]) * 2)
        ax.add_patch(elli)
        # 偏厚
        outlier_data = y.loc[y[y.columns[0]] == 3, :]

        # 偏薄
        outlier_data_less = y.loc[y[y.columns[0]] == 1, :]
        inner_data = full_data['pls']['pls'].loc[full_data['pls']['pls'].index.isin(outlier_data.index.tolist()+outlier_data_less.index.tolist()) == False, :]
        ax.plot(outlier_data.iloc[:, 0], outlier_data.iloc[:, 1], 'ro')
        ax.plot(outlier_data_less.iloc[:, 0], outlier_data_less.iloc[:, 1], 'bo')
        ax.plot(inner_data.iloc[:, 0], inner_data.iloc[:, 1], 'yo')
        name = str(self.picture_id)
        plt.savefig("E:\\shhl\\1118_两次PLS\\偏厚\\图\\"+name+".png")
        self.picture_id = self.picture_id +1
        plt.show()
from matplotlib.patches import Ellipse, Circle
import matplotlib.pyplot as plt

fig = plt.figure()
ax = fig.add_subplot(111)

ell1 = Ellipse(xy = (0.0, 0.0), width = 4, height = 8, angle = 30.0, facecolor= 'yellow', alpha=0.3)
cir1 = Circle(xy = (0.0, 0.0), radius=2, alpha=0.5)
ax.add_patch(ell1)
ax.add_patch(cir1)

x, y = 0, 0
ax.scatter([0,1], [0,1],color='red')
ax.scatter([2,1], [1,1],color='green')

plt.axis('scaled')

plt.axis('equal')   #changes limits of x or y axis so that equal increments of x and y have the same length

plt.show()
置信椭圆-python
卡方概率表:https://people.richland.edu/james/lecture/m170/tbl-chi.html
opencv画椭圆:https://docs.opencv.org/2.4.9/modules/core/doc/drawing_functions.html?highlight=ellipse
numpy.linalg.eig() 特征向量求解矩阵:https://docs.scipy.org/doc/numpy-1.10.1/reference/generated/numpy.linalg.eig.html
cov = np.cov(x, y) #计算协方差矩阵
lambda_, v = np.linalg.eig(cov) # 计算矩阵特征向量
lambda_ = np.sqrt(lambda_)
s=4.605 #根据置信区间查卡方概率表 95% 5.991 99% 9.21 90% 4.605
ax = plt.subplot(111, aspect=‘equal')

ell = Ellipse(xy=(np.mean(x), np.mean(y)),
width=lambda_[0]*np.sqrt(s) *2, height=lambda_[1]*np.sqrt(s)*2,
angle=np.rad2deg(np.arccos(v[0, 0])),facecolor=‘yellow',alpha=0.3)

ax.add_artist(ell)
plt.scatter(x, y)
plt.axis(‘scaled')
plt.axis(‘equal')
plt.show()
总结
以上为个人经验,希望能给大家一个参考,也希望大家多多支持码农之家。