本站收集了一篇SpringBoot相关的编程文章,网友马乐然根据主题投稿了本篇教程内容,涉及到SpringBoot、Prometheus、Grafana实现监控和报警、SpringBoot监控、SpringBoot+Prometheus+Grafana实现监控和报警相关内容,已被179网友关注,下面的电子资料对本篇知识点有更加详尽的解释。
SpringBoot+Prometheus+Grafana实现监控和报警
背景
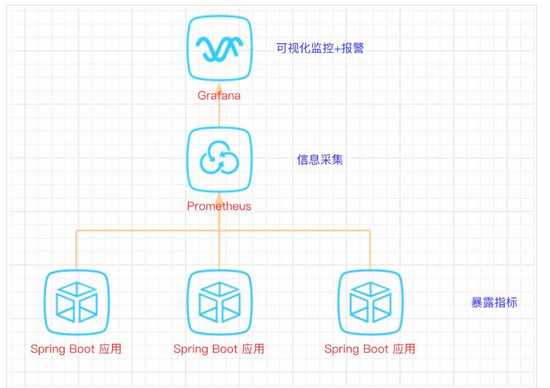
SpringBoot的应用监控方案比较多,SpringBoot+Prometheus+Grafana是目前比较常用的方案之一。它们三者之间的关系大概如下图:
开发SpringBoot应用
首先,创建一个SpringBoot项目,pom文件如下:
<dependency>
  <groupId>org.springframework.boot</groupId>
  <artifactId>spring-boot-starter-actuator</artifactId>
 </dependency>
 <dependency>
  <groupId>org.springframework.boot</groupId>
  <artifactId>spring-boot-starter-web</artifactId>
 </dependency>

 <dependency>
  <groupId>org.projectlombok</groupId>
  <artifactId>lombok</artifactId>
  <optional>true</optional>
 </dependency>

 <!-- https://mvnrepository.com/artifact/io.prometheus/simpleclient_spring_boot -->
 <dependency>
  <groupId>io.prometheus</groupId>
  <artifactId>simpleclient_spring_boot</artifactId>
  <version>0.8.1</version>
 </dependency>

 <dependency>
  <groupId>org.springframework.boot</groupId>
  <artifactId>spring-boot-starter-security</artifactId>
 </dependency>
注意: 这里的SpringBoot版本是1.5.7.RELEASE,之所以不用最新的2.X是因为最新的simpleclient_spring_boot只支持1.5.X,不确定2.X版本的能否支持。
MonitorDemoApplication启动类增加注解
package cn.sp;

import io.prometheus.client.spring.boot.EnablePrometheusEndpoint;
import io.prometheus.client.spring.boot.EnableSpringBootMetricsCollector;
import org.springframework.boot.SpringApplication;
import org.springframework.boot.autoconfigure.SpringBootApplication;
@EnablePrometheusEndpoint
@EnableSpringBootMetricsCollector
@SpringBootApplication
public class MonitorDemoApplication {

 public static void main(String[] args) {
 SpringApplication.run(MonitorDemoApplication.class, args);
 }

}
配置文件application.yml
server:
 port: 8848
spring:
 application:
 name: monitor-demo

security:
 user:
 name: admin
 password: 1234
 basic:
 enabled: true
 # 安全路径列表,逗号分隔,此处只针对/admin路径进行认证
 path: /admin

# actuator暴露接口的前缀
management:
 context-path: /admin
 # actuator暴露接口使用的端口,为了和api接口使用的端口进行分离
 port: 8888
 security:
 enabled: true
 roles: SUPERUSER
测试代码TestController
@RequestMapping("/heap/test")
@RestController
public class TestController {

 public static final Map<String, Object> map = new ConcurrentHashMap<>();

 @RequestMapping("")
 public String testHeapUsed() {
 for (int i = 0; i < 10000000; i++) {
  map.put(i + "", new Object());
 }
 return "ok";
 }
}
这里的逻辑就是在请求这个接口后,创建大量对象保存到map中增加堆内存使用量,方便后面测试邮件报警。
启动项目后,可以在IDEA中看到有很多Endpoints,如图:
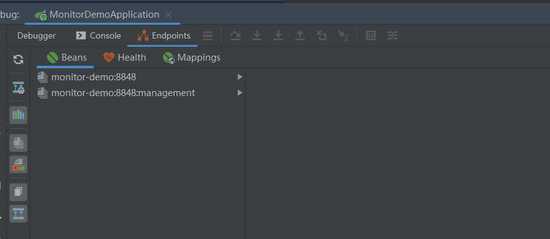
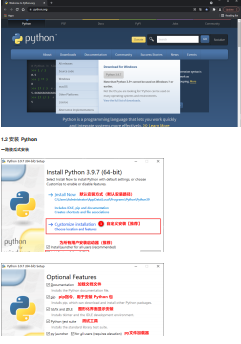
开始我的IDEA是不显示这个Endpoints,后来发现是我使用的idea版本太老了,还是2017.1的,
而这个需要 idea2017.2版本以上才能看到。
后来只好重新下载安装,弄了好久。。。。
启动完毕,访问http://localhost:8888/admin/prometheus就可以看到服务暴露的那些监控指标了。
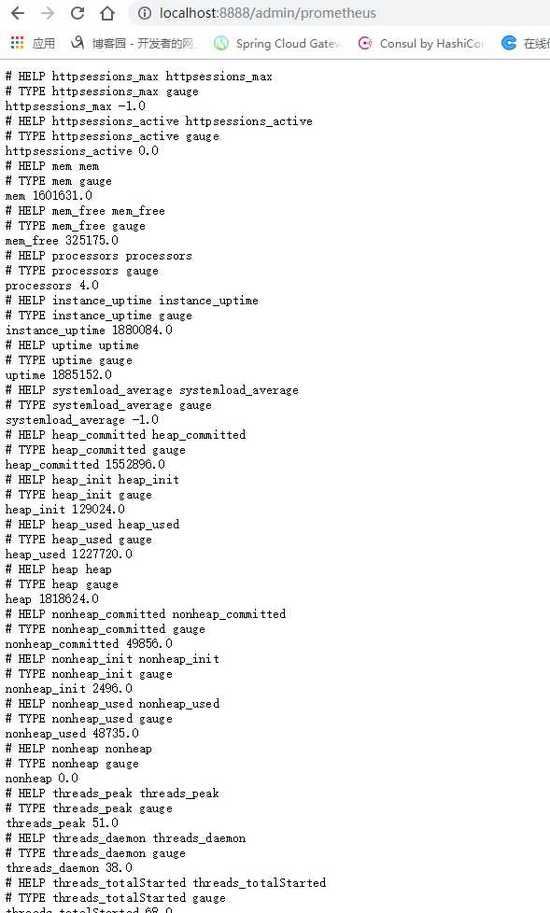
注意:
由于开启了安全认证,所以访问这个URL的需要提示输入账号/密码,如果提示404请检查下你的请求地址是否正确,如果不设置management.context-path则默认地址是http://ip:port/prometheus
安装Prometheus
下载地址点击这里,本文下载的是Windows版本prometheus-2.17.2.windows-amd64.tar.gz。
解压后修改prometheus.yml文件,配置数据采集的目标信息。
scrape_configs:
 # The job name is added as a label `job=<job_name>` to any timeseries scraped from this config.
 # - job_name: 'prometheus'

 # metrics_path defaults to '/metrics'
 # scheme defaults to 'http'.

 # static_configs:
 # - targets: ['localhost:9090']
 - job_name: 'monitor-demo'
 scrape_interval: 5s # 刮取的时间间隔
 scrape_timeout: 5s
 metrics_path: /admin/prometheus
 scheme: http
 basic_auth: #认证信息
 username: admin
 password: 1234
 static_configs:
 - targets:
 - 127.0.0.1:8888 #此处填写 Spring Boot 应用的 IP + 端口号
更多配置信息请查看官方文档。
现在可以启动Prometheus了,命令行输入:prometheus.exe –config.file=prometheus.yml
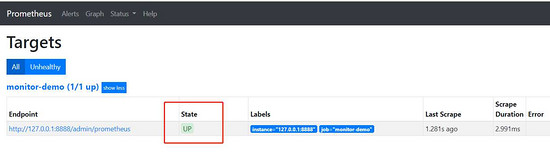
访问http://localhost:9090/targets,查看Spring Boot采集状态是否正常。
安装Grafana
下载地址点击这里,本文用到的是Windows版本grafana-6.3.3.windows-amd64.zip。
解压后运行bin目录下的grafana-server.exe启动,游览器访问http://localhost:3000即可看到登录页面,默认账号密码是admin/admin。
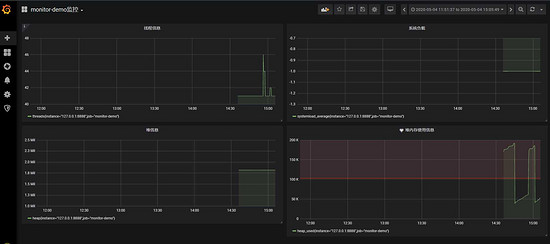
现在开始创建自己的可视化监控面板。
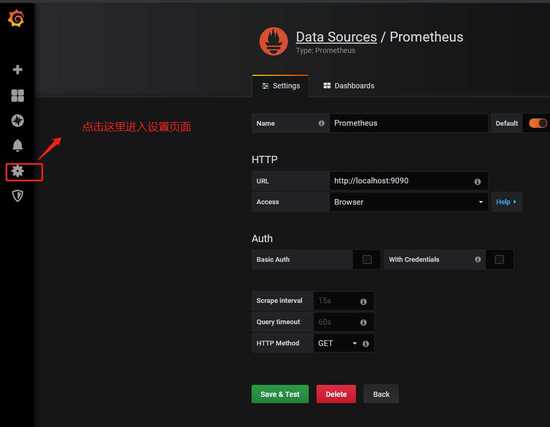
1.设置数据源
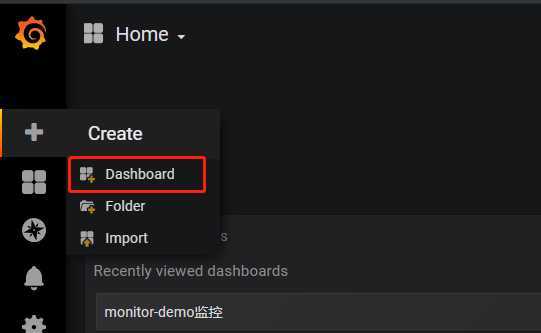
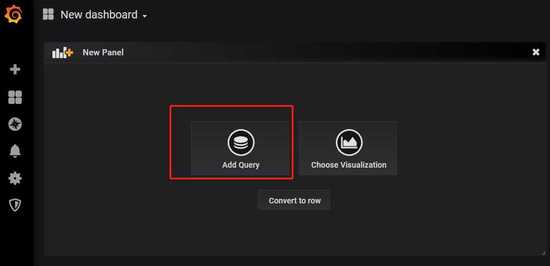
2. 创建一个Dashboard
3. 填写采集的指标点
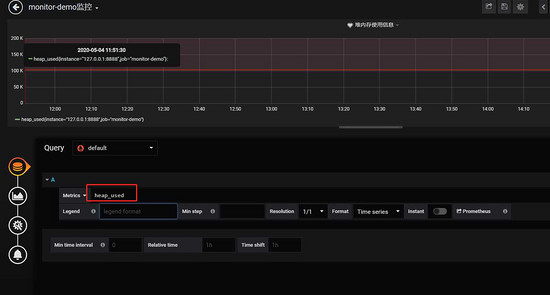
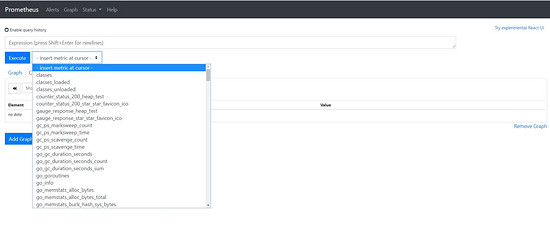
注意: 这里的指标点不能随便填,必须是已有的可以在 Prometheus看到。
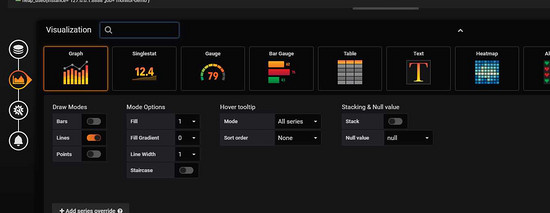
4.选择图表样式
5.填写标题描述
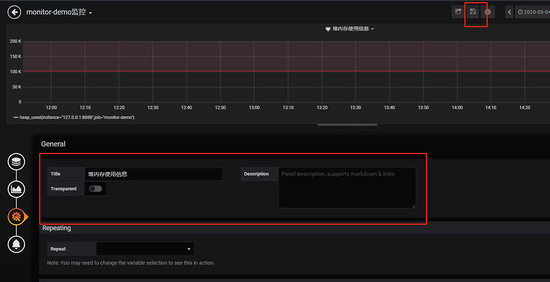
最后点击右上角的保存,输入Dashboad的名称即可。
五、添加邮件报警
在实际项目中当监控的某的个指标超过阈值(比如CPU使用率过高),希望监控系统自动通过短信、钉钉和邮件等方式报警及时通知运维人员,Grafana就支持该功能。
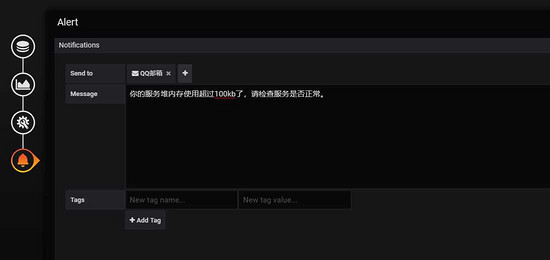
第一步: 点击[Alerting]——>[Notification channels]添加通知通道
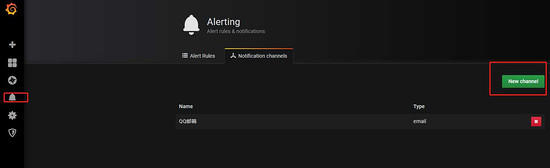
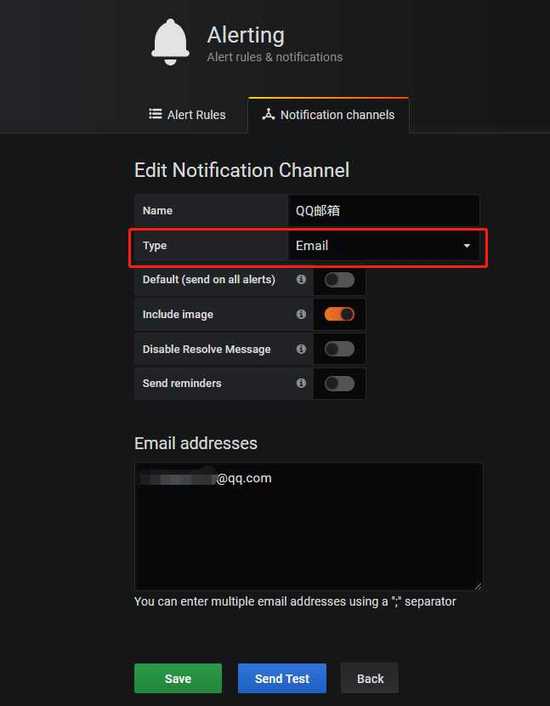
这里的Type有很多选项,包括webhook、钉钉等,这里以邮件为例。
第二步: 邮箱配置
Grafana默认使用conf目录下defaults.ini作为配置文件运行,根据官方的建议我们不要更改defaults.ini而是在同级目录下新建一个配置文件custom.ini。
以腾讯企业邮箱为例,配置如下:
#################################### SMTP / Emailing #####################
[smtp]
enabled = true
host = smtp.exmail.qq.com:465
user = xxxx@ininin.com
# If the password contains # or ; you have to wrap it with triple quotes. Ex """#password;"""
password = XXX
cert_file =
key_file =
skip_verify = true
from_address = xxxx@ininin.com
from_name = Grafana
ehlo_identity = ininin.com
然后需要重启Grafana,命令grafana-server.exe -config=E:filegrafana-6.3.3confcustom.ini
第三步: 为指标添加alert
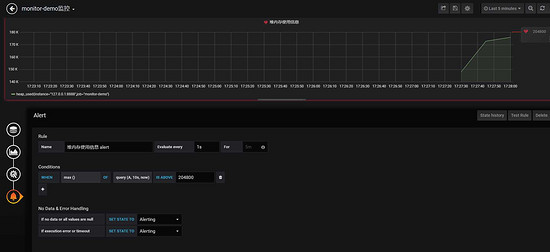
Evaluate every
表示检测评率,这里为了测试效果,改为1秒
For
如果警报规则配置了For,并且查询违反了配置的阈值,那么它将首先从OK变为Pending。从OK到Pending Grafana不会发送任何通知。一旦警报规则的触发时间超过持续时间,它将更改为Alerting并发送警报通知。
Conditions
when 表示什么时间,of 表示条件,is above 表示触发值
同时,设置了is above后会有一条红线。
If no data or all values are null
如果没有数据或所有值都为空,这里选择触发报警
If execution error or timeout
如果执行错误或超时,这里选择触发报警
注意: 下一次触发,比如10秒后,它不会再次触发,防止报警风暴产生!
第四步: 测试
请求http://localhost:8848/heap/test接口后,内存升高大于设置的阈值,然后就收到报警邮件。
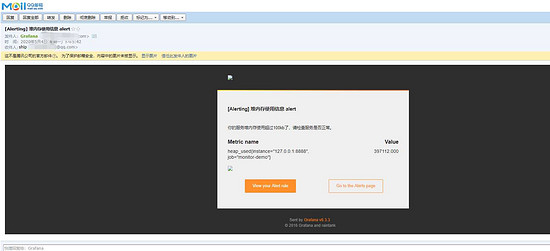
这里图片没有显示出来,搞不懂为什么。
到此这篇关于SpringBoot+Prometheus+Grafana实现应用监控和报警的详细步骤的文章就介绍到这了,更多相关SpringBoot+Prometheus+Grafana实现监控和报警内容请搜索码农之家以前的文章或继续浏览下面的相关文章希望大家以后多多支持码农之家!